
Using Keycloak and Kafka Stream to detect identity anomalies
Using Keycloak and Kafka Stream to detect identity anomalies


Lately, Fraud detection and prevention become a pertinent subject to numerous companies, and they put a lot of effort into it.
Our previous article, Let’s Publish Keycloak Events to Kafka using SPI (plugins), covered how we can stream Keycloak events into Kafka using the power of the SPI, and in this article we will use them to build a system that can help us detect malicious login attempts, by using the Kafka Streams’ real-time processing power.
As part of our System, we will focus on new devices that our System has never seen before, along with the number of failures for a certain time window. Furthermore, we can zoom in on other aspects, like IP address, location, etc…
Our Real-time Fraud prevention Architecture

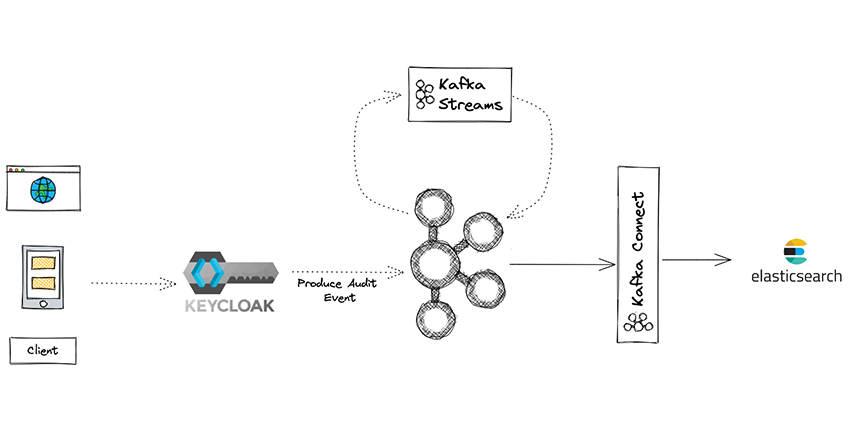
Firstly the client submits a login into Keycloak after that Keycloak will log the attempt and send it to Kafka topic as we discussed in the previous blog, the second step consists of processing the data using Kafka Streams application which will be handled by our fraud prevention system.
We will discuss the details of the system later.
In the final step, we visualize the malicious attempts and analyze them, and for that, we use Kafka Connect to retrieve the data from Kafka topics and send it to Elasticsearch.

For this example, we will build two blocks in our system:
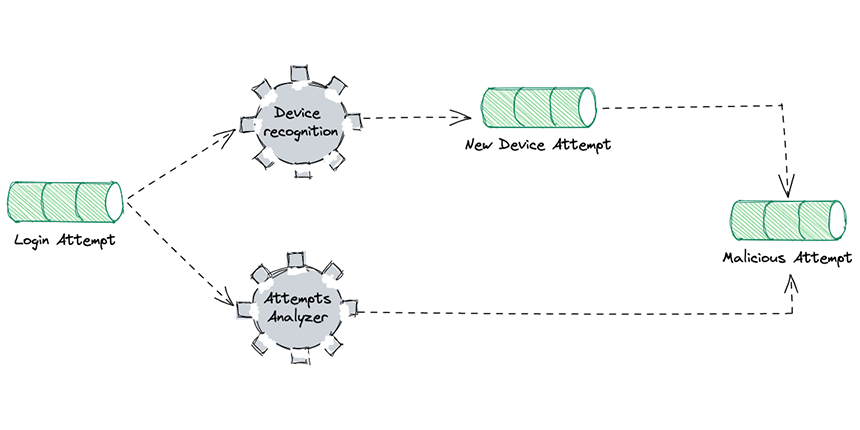
A device recognition block, which is responsible for discovering if there are new devices or suspicious attempts.
The attempts analyzer block analyzes the behaviors of the user in this example we will focus on the number of failed attempts.
What’s Kafka Stream?

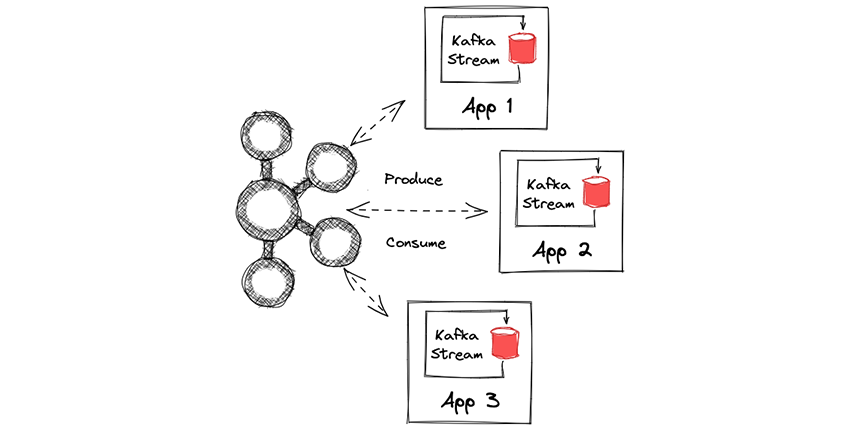
Kafka Streams is a client library for building applications and microservices, it produces and consumes events from the Kafka cluster, it can be written in Java or Scala, and it affords a simple and easy way to develop and deploy the applications by providing defined DSL for processing operations.
Kafka brokers do not perform any computation logic, and all processing happens on Kafka Stream application nodes.
Let’s go deep!
In our system, we filter our Audit Event records to pick just the LOGIN and LOGIN_ERROR events before proceeding to our fraud prevention system.
String[] ELLIGIBLE_EVENT = {
  "LOGIN", "LOGIN_ERROR"
};

StreamsBuilder builder = new StreamsBuilder();

builder
  .stream("keycloak-event", Consumed.with(stringSerde, jsonSerde))
  .peek((k, v) -> logger.info("Observed key:{} event: {}", k, v.toString()))
  .filter((k, v) -> Arrays.asList(ELLIGIBLE_EVENT).contains(v.getType()))
  .to(LOGIN_ATTEMPT_TOPIC, Produced.with(stringSerde, jsonSerde));
Device Recognition System:

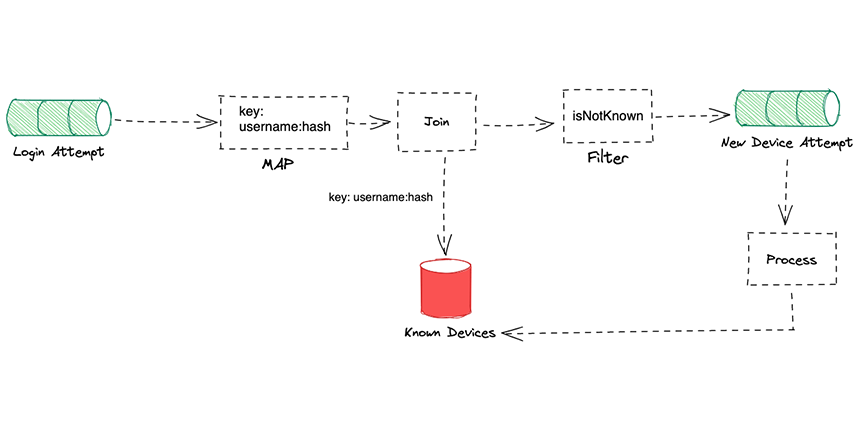
We use the login attempt stream as an input to the device recognition system, which then retrieves the device information used in the login attempt to compare it with the devices already stored for a specific user, but we actually use a join operator to join the Know Devices table that stores all known devices for the user with the login attempt stream.
As part of the Kafka stream API, a table is represented by KTable, which takes a topic stream of records from a topic and reduces it to unique entries, while a stream is represented by KStream, which retrieves all records from the topic.
KStream<String, KeycloakDto> deviceStream = builder
  .stream(LOGIN_ATTEMPT_TOPIC, Consumed.with(stringSerde, keycloakJsonSerde))
  .filter((key, value) -> value != null)
  .map((key, v) -> new KeyValue<>(v.getUsername() + ":" + getHashDevice(v.getDevice()), v))
  .leftJoin(knownDevices, (left, right) -> {
    if (right == null) return left;
    return null;
  })
  .filter((key, value) -> value != null);
deviceStream.to(NEW_DEVICE_ATTEMPT_TOPIC, Produced.with(stringSerde, keycloakJsonSerde));
We begin by removing null records from our data, then we apply a map operator to transform the key username into a combination of the username and the hash of the device username:hash.
The hash of the device is calculated by encoding the critical information such as the OS, OS version, name of the device, and if it’s a mobile device or not in base64.
The following is a representation of the function responsible for hashing device information.
 static String getHashDevice(DeviceDto deviceDto) {
  String deviceHash = deviceDto.getOs() + deviceDto.getOsVersion() + deviceDto.getDevice() + deviceDto.isMobile();
  return Base64.getEncoder().encodeToString(deviceHash.getBytes(StandardCharsets.UTF_8));
}
We then join our record with the Know Devices table using the key username:hash considering that records streamed to the topic have the same key if the join operator returns a null value on the right side that means that the system has never seen this device for the considering username, and it should be sent to a new device attempt, otherwise we assume that it already exists.
Ultimately, we will consider the records in the New Device Attempts as Known Devices or not. (This part will not be covered in this post)
Attempts Analyzer:

We will use a minimalistic example to demonstrate the Attempts Analyzer.
The attempts will be calculated based on the number of failures over a period of time.
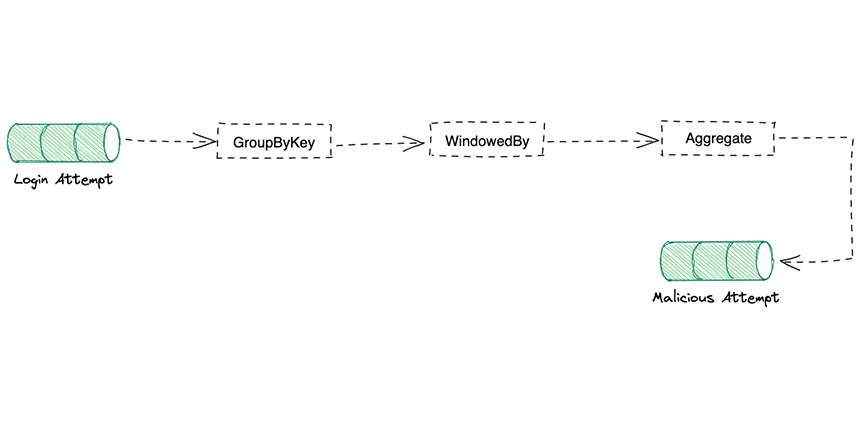
Our approach is to :
Stream all the items from the Login Attempts topic
Group them by key.
Aggregate the results based on a sliding window of
5 minutesCalculate the number of failures in that period
Send the items with more than
3 failuresto themalicious attempttopic for further analysis.
The following code describes this:
 builder
  .stream(LOGIN_ATTEMPT_TOPIC, Consumed.with(stringSerde, jsonSerde))
  .filter((key, value) -> value != null)
  .peek((k, v) -> logger.info("event fraude key : {} value : {}", k, v))
  .groupByKey()
  .windowedBy(TimeWindows.of(Duration.ofMinutes(5)))
  .aggregate(FraudDto::new, (k, v, fraud) -> {
    fraud.setUsername(v.getDetails().getUsername());
    fraud.setIpAddress(v.getIpAddress());
    fraud.setDeviceDto(v.getDevice());
    if ("LOGIN_ERROR".equals(v.type)) fraud.setNbLoginFailure(fraud.getNbLoginFailure() + 1);
    return fraud;
  }, Materialized.with(stringSerde, fraudSerde)).toStream()
  .map((Windowed<String> key, FraudDto fraud) -> new KeyValue<>(key.key(), fraud))
  .filter((k, v) -> v.getNbLoginFailure() > 3)
  .to(MALICIOUS_ATTEMPT_TOPIC, Produced.with(stringSerde, fraudSerde));
Let’s visualize our work
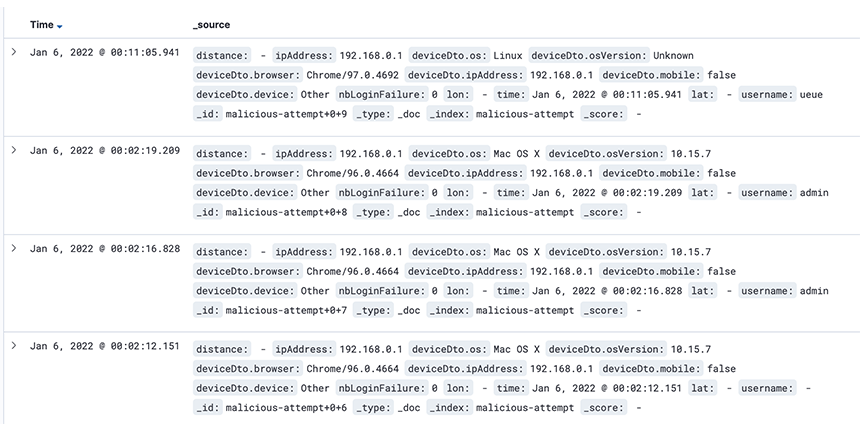
Until now, our system has worked perfectly, we have been able to analyze and collect malicious attempts, store them in a Kafka topic, and browse it, but it is only a topic and the possibility of exploit are limited .
We can extends our architecture with another specialized system for analytics .
For example, we can stream the data to Elasticsearch to visualize and analyze it with the power of Kibana.
Kafka Connect make it simple to stream data from Kafka to Elasticsearch by using a specific Elasticsearch connector.
Kafka Connect

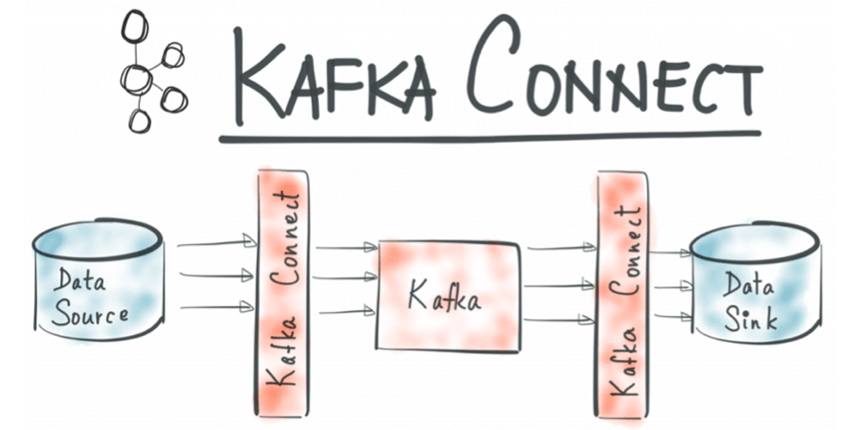
Kafka Connect is an open-source tool of Apache Kafka that streams data between Kafka clusters and other databases (Elasticsearch, …). It does this by defining connectors that can send large data sets into and out of Kafka clusters. There are two types of connectors: Source and Sink.
Source connector: Delivers data from Kafka topics into secondary indexes.
Sink connector: Ingests database tables and streams table updates to
Two steps are required to accomplish this:
Create a dynamic mapping template for Elasticsearch indices to retrieve the timestamps of the attempts for further analysis since Elasticsearch considers the field time present in our record as a simple long number.
Configure Kafka’s Connector using JSON data consisting of the source topic, elasticsearch indices to load and some other configurations.
The corresponding scripts are below:
 curl -s -XPUT "<http://localhost:9200/_template/malicious-attempt/>" -H 'Content-Type: application/json' -d'
    {
      "template": "*",
      "mappings": { "dynamic_templates": [ { "dates": { "match": "time", "mapping": { "type": "date" } } } ]  }
    }'

curl -X POST <http://localhost:8083/connectors> -H "Content-Type: application/json" -d '{
 "name": "malicious-connector",
 "config": {
    "connector.class": "io.confluent.connect.elasticsearch.ElasticsearchSinkConnector",
    "connection.url": "<http://elasticsearch:9200>",
    "tasks.max": "1",
    "topics": "malicious-attempt",
    "type.name": "_doc",
    "key.converter": "org.apache.kafka.connect.storage.StringConverter",
    "value.converter": "org.apache.kafka.connect.json.JsonConverter",
    "key.ignore": "true",
    "schema.ignore": "true",
    "value.converter.schemas.enable": "false"
 }
}'

Conclusion
The entire code is available here: kafka-stream-fraud-java
In this article, we discussed how we can build a real-time fraud prevention system, using the Kafka Stream API and Elasticsearch to visualize the fraud attempts. We can do this in a different way, with KsqlDB, maybe in another post.
If you like this blog, please like & share 🙂